TL;DR
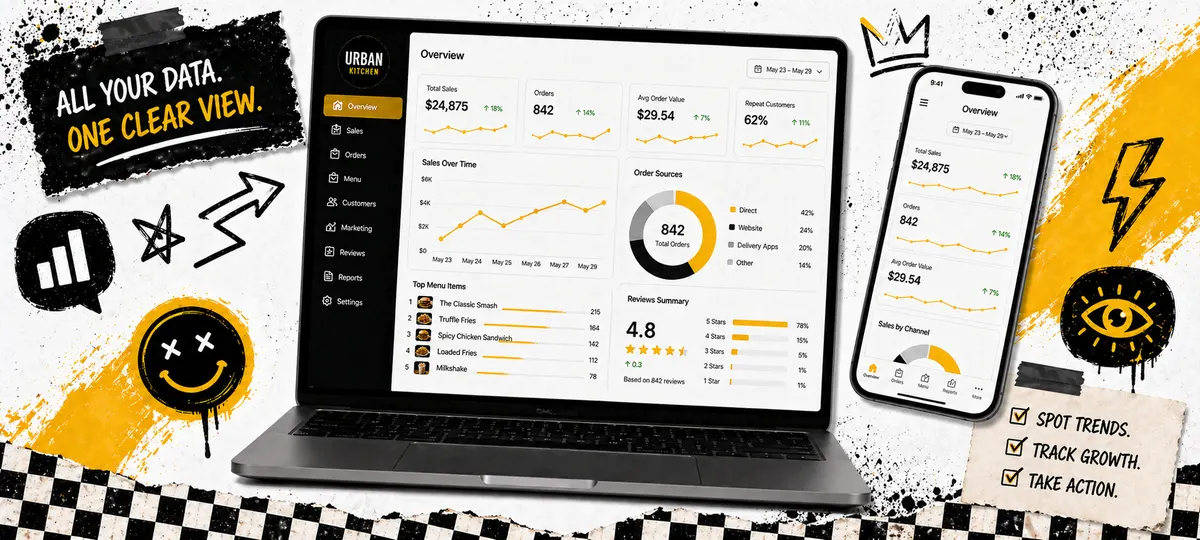
Start with five reports: sales by channel, menu item performance, repeat customers, source attribution, and campaign results. Your restaurant analytics software should connect orders to customer data, not only show gross sales. Generic BI tools can look powerful, but most independents need a dashboard that explains direct orders, marketplace mix, repeat rate, average order value, and which marketing actions moved revenue. Use the checklist below before buying another reporting tool.
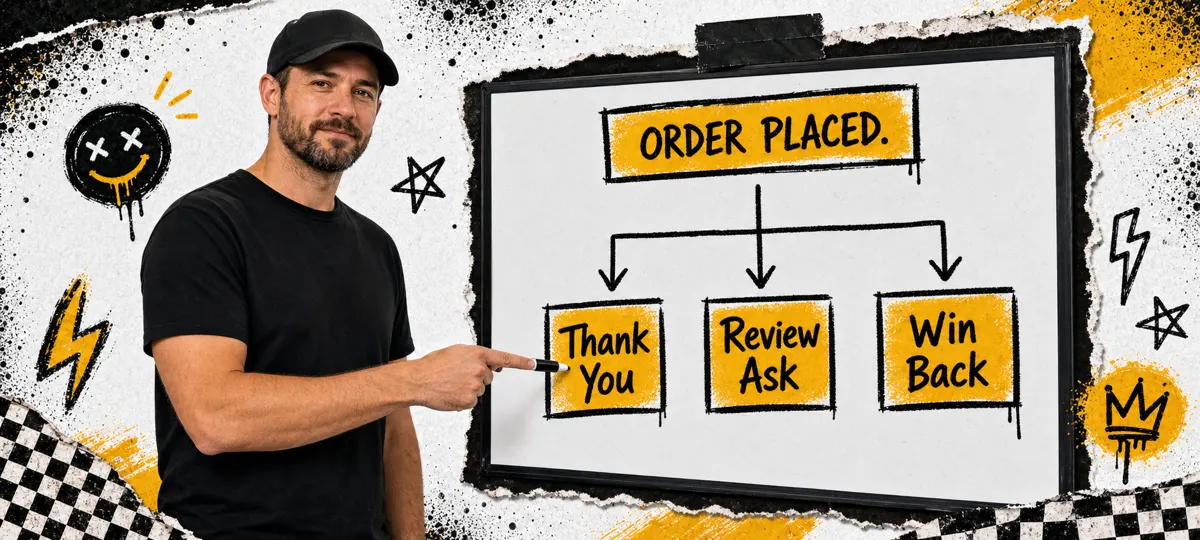
A restaurant dashboard can look impressive and still fail the operator. If it only shows yesterday's gross sales, it is not helping you decide what to change before Friday service.
The right restaurant analytics software connects sales, menu performance, customer behavior, order sources, and marketing results. The goal is not more charts. The goal is knowing which lever to pull next.
The five reports every restaurant should see first
Do not start with every metric a platform can export. Start with the reports that change weekly decisions: sales by channel, menu item performance, repeat customer movement, source attribution, and campaign results.
Analytics checklist
Restaurant reporting software buying checklist
Use this before you buy another analytics dashboard or business intelligence tool.
- Can you separate direct orders, QR orders, marketplace orders, pickup, delivery, and catering?
- Can you see average order value by channel and menu category?
- Can you spot first-time buyers, repeat customers, and lapsed guests?
- Can you connect SMS, email, loyalty, and promo campaigns to completed orders?
- Can managers understand the dashboard without a data analyst?
- Can reports be exported or scheduled for owners, bookkeepers, and partners?
- Can you compare customer data growth, not only top-line sales?
Generic BI tools versus restaurant reporting software
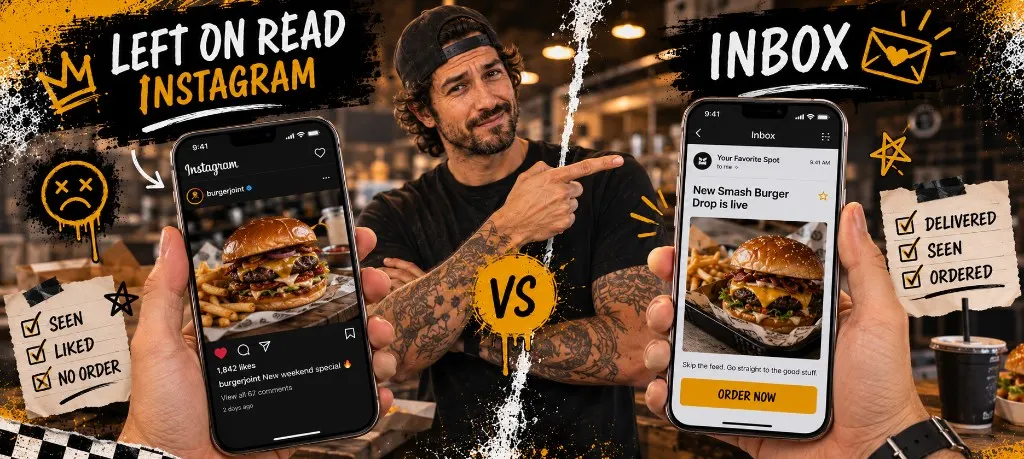
Generic business intelligence software can be useful for multi-location groups with a data team. Most independents need something tighter: a restaurant reporting dashboard that explains what happened in the ordering flow, where the customer came from, and whether that customer can be reached again.
That is why the analytics conversation should sit next to your ordering strategy. A direct order tells you more than a marketplace ticket because it can connect the order, the guest, the channel, and the follow-up path. Pair this guide with the restaurant customer list guide if you are still building the data foundation.
Use channel mix to find margin leaks
A good restaurant sales dashboard should show more than total revenue. It should show whether orders are moving toward channels you control. If marketplace sales stay flat while direct ordering and repeat customer rate climb, your business is becoming less dependent on rented demand.
Use the marketplace fee calculator to put a dollar value on that mix. A 20% commission on a $28 ticket is not an abstract fee. It is $5.60 that could have funded loyalty, SMS, or better packaging.
Where Outbites fits
Outbites reporting is built around the operator questions that come up every week: Are direct orders growing? Which menu items lift average ticket? Are first-time guests coming back? Did that SMS send create orders? Are Google and QR links sending people to a channel we own?
If you want the product version, start with the Outbites restaurant analytics and reporting page. It shows how sales reports, customer insights, order sources, and marketing attribution fit inside the broader direct ordering system.
Templates
Templates

Katie Carswell
Account & Social Media Manager
Sharing firsthand stories and lessons learned from running an independent restaurant: margins, marketing, and owning your customer relationships.
How this guide was put together
This article was written for independent food businesses looking for practical ways to grow direct orders, repeat visits, and customer relationships. We keep the advice operator-focused, avoid generic playbooks, and update posts when the restaurant marketing landscape changes.